Setting up Grafana to persist in PostgreSQL with Helm
Everyone uses Grafana right? We use it a lot at REVSYS, but wanted to get it set up in my personal Kubernetes cluster. Don’t ask why, it’s silly.
Another Grafana tutorial???
There are tons of good tutorials on installing Grafana in your cluster with Helm, but none of them showed how to do it using PostgreSQL as it’s persistence.
To be clear, what I’m talking about here is storing Grafana’s own users, dashboards, and other information in PostgreSQL and NOT the metrics Grafana will be querying and displaying.
The default persistence most blog posts and tutorials use is the slightly easier option of having Grafana store it’s data in a SQLite database in a persistent volume.
There is nothing wrong with doing that, it works fine and is robust enough for most use cases. For me however, I didn’t want to have to setup (and pay for) another persistent volume and I already have a PostgreSQL server in my cluser. It’s actually an instance of TimescaleDB, but that doesn’t matter for the purposes of this post.
Things you will likely need
Grafana has lots of use use cases, but it’s mostly used with Prometheus. So to help verify everything is setup correctly, having Prometheus or some other database that is queryable by Grafana is useful.
And of course you will need access to a PostgreSQL database somewhere. Mine is running inside my k8s cluster, but that isn’t necessary for this to work. You can just as easily use a managed PostgreSQL instance from your cloud provider.
And you’ll need to be a bit familiar with Helm for any of this to make sense.
Set up a database user for Grafana
First things first, we need a database user to own the database we’re going to create. Connect to your database as a superuser and issue the following SQL:
CREATE USER grafana WITH LOGIN NOSUPERUSER INHERIT NOCREATEDB
  NOCREATEROLE NOREPLICATION PASSWORD
'please-pick-something-secure';We’ve used the very imaginative name of grafana for the user here to make things
easier. I find naming things as simply as possible pays off when I have to revisit
this again in a year. If the username was kermit-the-frog, it would work, but not at all
clear.
We’re being specific here with the permissions given to this user to lock it down a bit to avoid any security issues in Grafana giving someone a path to create new databases or users in our PostgreSQL instance. You should always do this whenever you can.
Set up the database for Grafana
Now that we have our user, we need to create a database owned by that user. Run this SQL:
CREATE DATABASE grafana WITH OWNER = grafana ENCODING = 'UTF8'
LC_COLLATE = 'C.UTF-8' LC_CTYPE = 'C.UTF-8';Ok, our database is all ready for Grafana to use it. I have also been very original
here and named the database grafana.
The important Helm bits
We really love using FluxCD at work and so I’m also using it
in my home cluster. It’s just a system for managing all of your Helm repositories,
releases and values file changes in git that are automatically synchronized with
the cluster without having to actually run helm update yourself.
The important bit of information that was hard to find is how to tell Grafana to use PG as it’s datastore. In Grafana’s chart values you will find a stanza that reads:
grafana.ini:
  paths:
    data: /var/lib/grafana/
    logs: /var/log/grafana
    plugins: /var/lib/grafana/plugins
    provisioning: /etc/grafana/provisioning
  analytics:
    check_for_updates: true
  log:
    mode: console
  grafana_net:
url: https://grafana.netThese are the defaults that are converted from YAML format to INI format and dumped into the right file for you by Helm (and mounting a ConfigMap). I changed this to be:
grafana.ini:
  paths:
    data: /var/lib/grafana/
    logs: /var/log/grafana
    plugins: /var/lib/grafana/plugins
    provisioning: /etc/grafana/provisioning
  analytics:
    check_for_updates: true
  log:
    mode: console
  grafana_net:
    url: https://grafana.net
database:
type: postgres
host: db.timescaledb:5432
name: grafana
user: grafana
password: dog-farts-smell
ssl_mode: requireHere my host is db.timescaledb because the Kubernetes service is named db
and it is in the timescaledb namespace.
Initially, Grafana gave me an error because I didn’t have the last line ssl_mode: require
so Grafana was connecting to the database without SSL and Timescale, correctly, is
setup to only allow users to connect with a password when using SSL.
Be sure you have persistence.enabled = false in your Helm values otherwise it
will create a persistent volume that will go unused.
Result
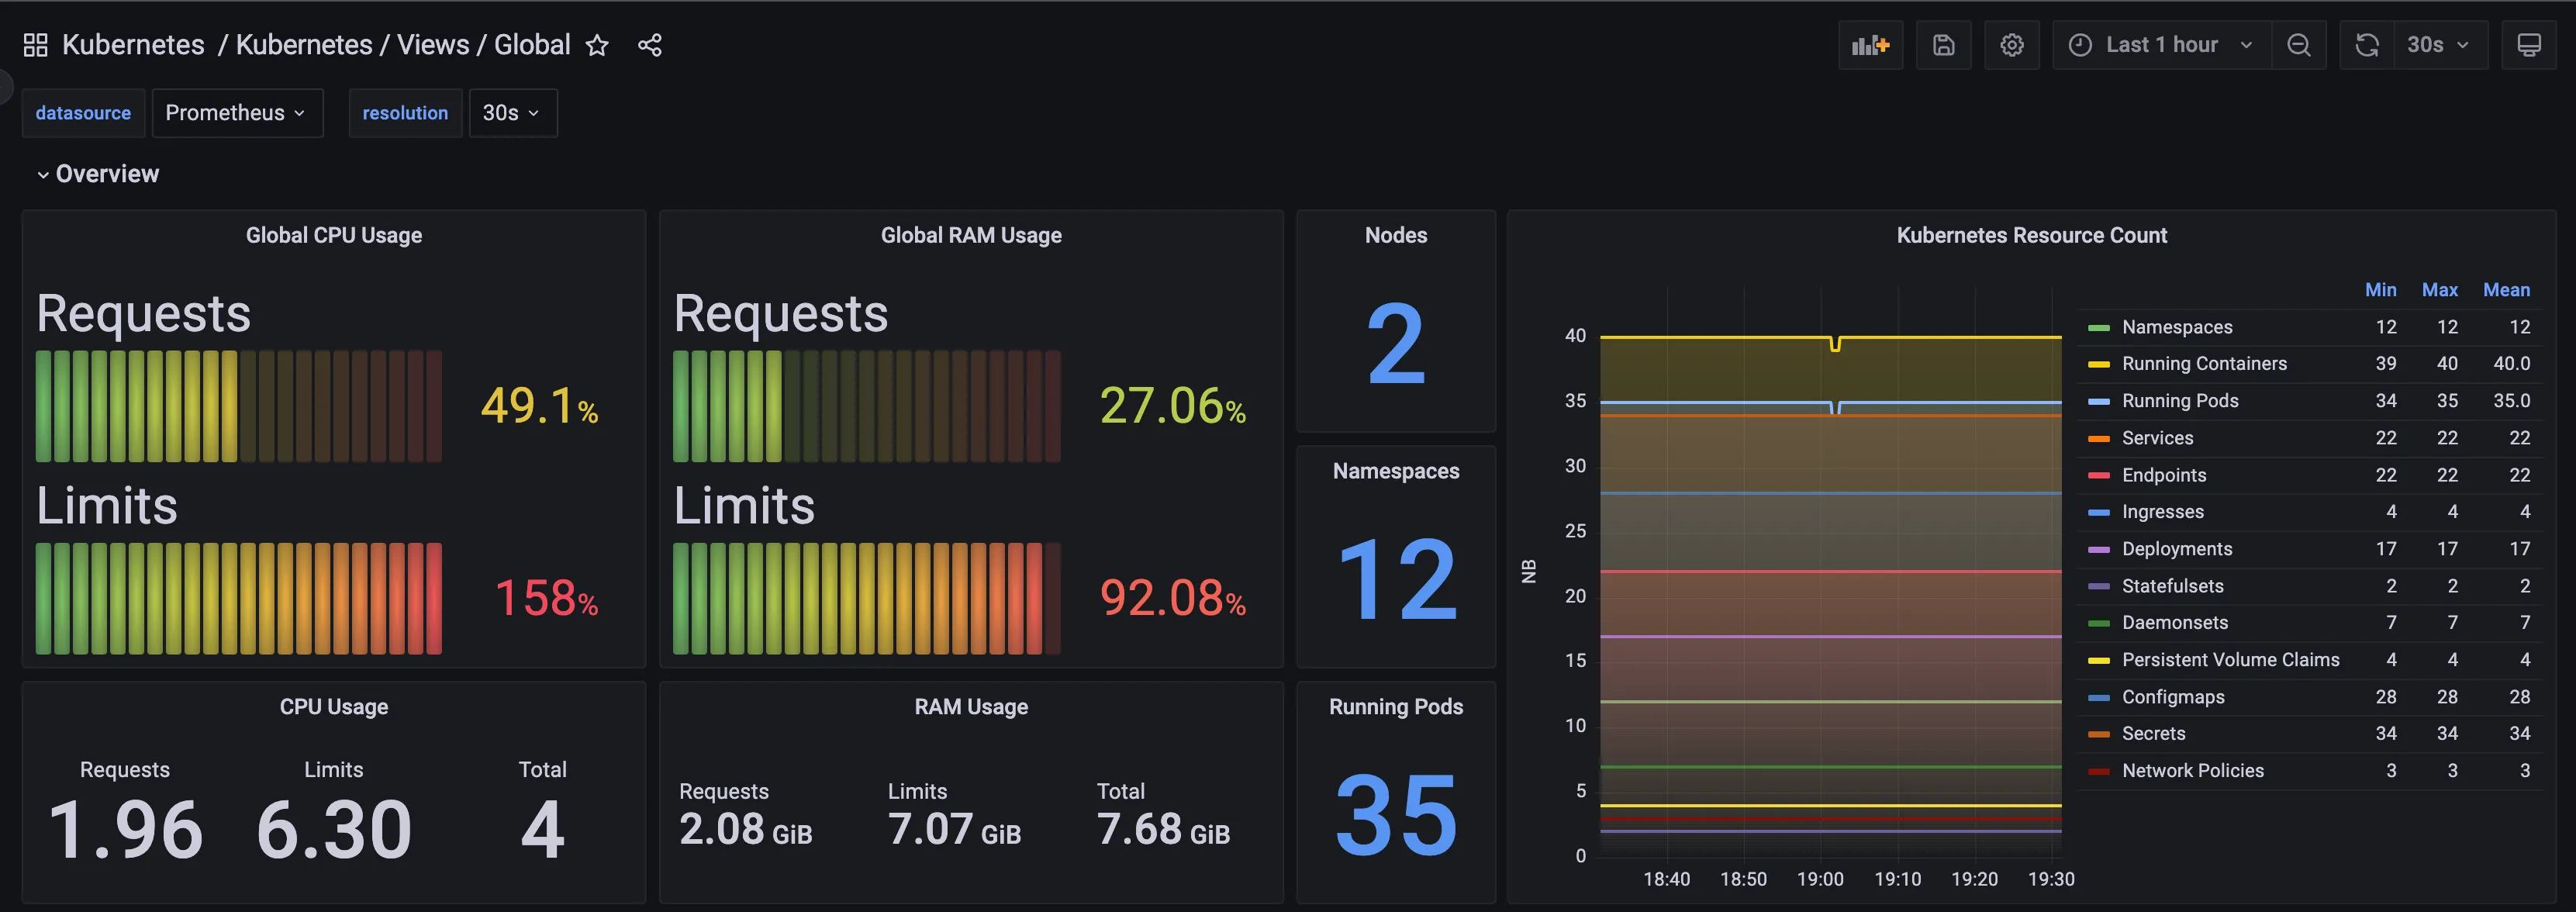
Considering TimescaleDB’s chart automatically sets up pgbackrest I now have
a persistent AND backed up database of my Grafana users, dashboards, and alerts.
Hope this proves useful to you!

Frank Wiles
Founder of REVSYS, Django Steering Council, PSF Fellow, and former President of the Django Software Foundation .
Expert in building, scaling and maintaining complex web applications. Want to reach out? Contact me here or use the social links below.
Join my newsletter!
Get the occasional email from me when I write something new.
Struggling with architecture decisions or team dynamics? Ask me any tech, business process, or entrepreneurial question, and I'll do my best to help!